


An innovative visual lean management tool to boost your activities
In a professional environment saturated with information and complex projects, clarity is essential. This is where visual management comes into play. With Bubble Plan, simplify the way you manage your projects.
Imagine a tool that brings your ideas to life by making them visible and understandable to everyone. Bubble Plan is not only intuitive, it is powerful. Its advanced graphical interface allows you to visualize every step and information of your projects, anticipate obstacles and effectively coordinate your teams.
No more chaos of scattered data: Bubble Plan centralizes, simplifies and energizes your operations. Give your team members a clear and engaging overview, to turn every project into a success.
4 visual elements to track project performance in an enlightened way

Start your FREE trial now!
Enjoy all Premium features for 14 days
Start your FREE trial now!
Enjoy all Premium features for 14 days
Strengthen team communication through visuals
Bubble Plan is a collaborative project management tool, for which the dimension of Visual Management is at the heart of all your project management methods.
The dynamics of management through graphic elements simplifies the transmission of information. Everything is centralized, everything is clearly displayed to reduce:- e-mails,
- meetings,
- elements transmitted on the fly.
You gain in productivity and in anticipation over your entire scope. This method promotes organizational efficiency and improves production quality within the company. The use of this collaboration space allows you to achieve objectives more quickly.

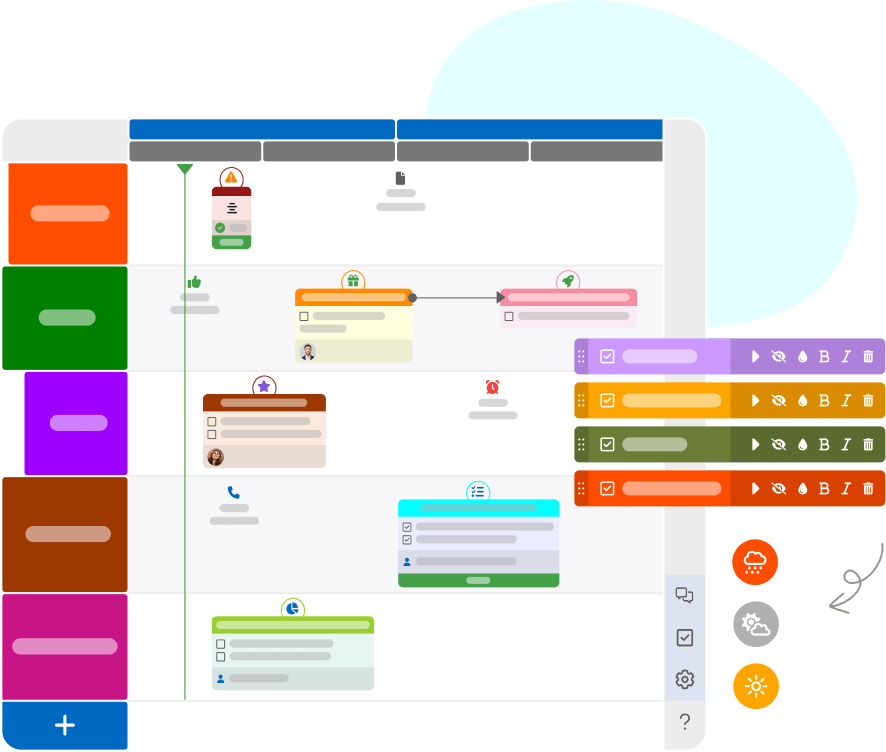
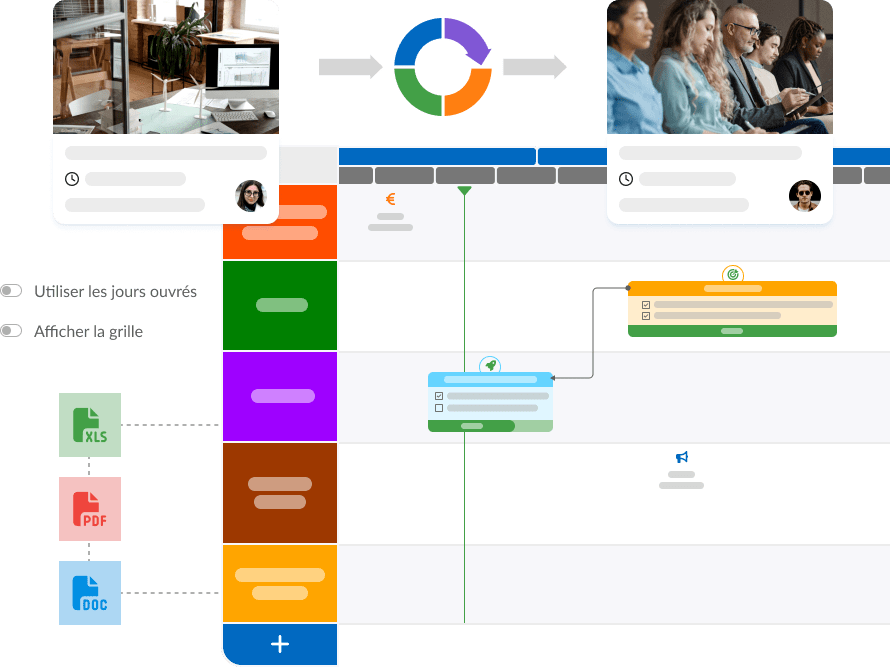
Strong graphic elements
You structure your planning according to your wishes, with colored lines. Then prioritize your processes and information on 3 levels of graphic indentation. This visual hierarchy allows you to better perceive the levels of the project and improve production performance.
Whether it's modeling macro, operational aspects or working with sub-parts of main phases or themes, you can easily present and prioritize your projects.
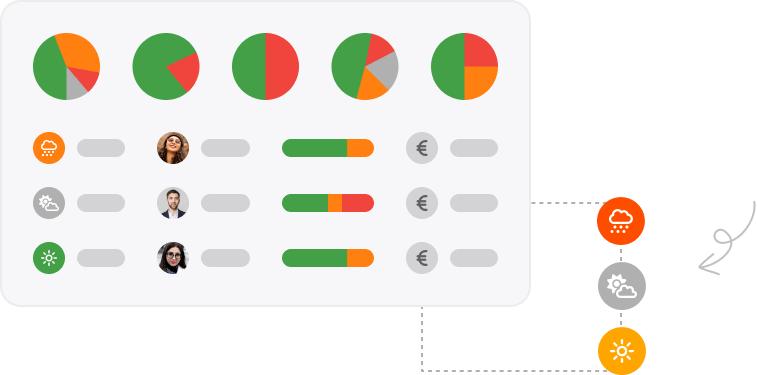
You have in your project sheet a 'Follow-up Point' function, illustrated by weather icons, an effective tool in business. You can easily convey a feeling about the project's progress and status.
This valuable information naturally rises in your Portfolio Projects dashboard, to allow quick management and decision-making.
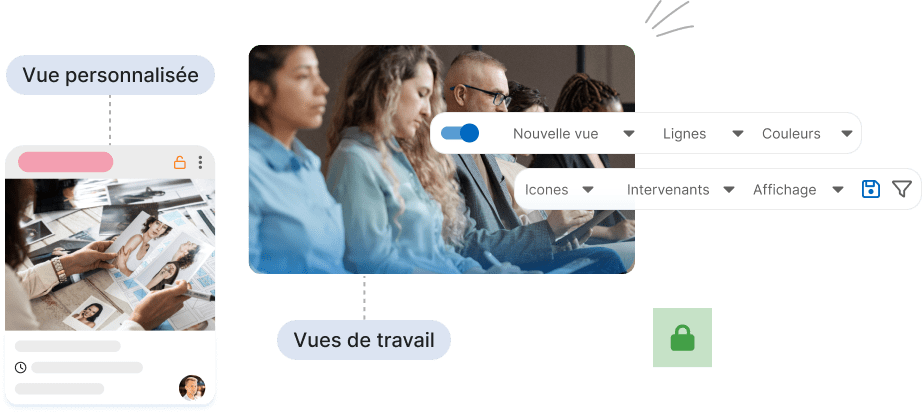
Custom views to visualize performance
Customize your plannings with specific filters:
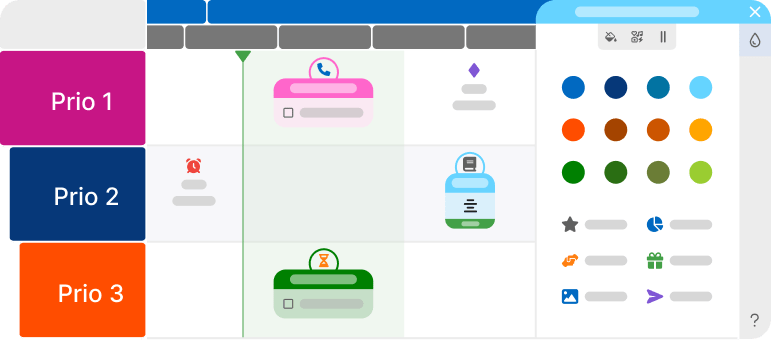
- isolate elements by color: create filters to display tasks by category, team or project. Switch between a colorful global view and filtered views for effective management at all levels.
- filter by icon category: apply filters to focus the display on specific types of icons, such as alert icons, for targeted management of emergencies.
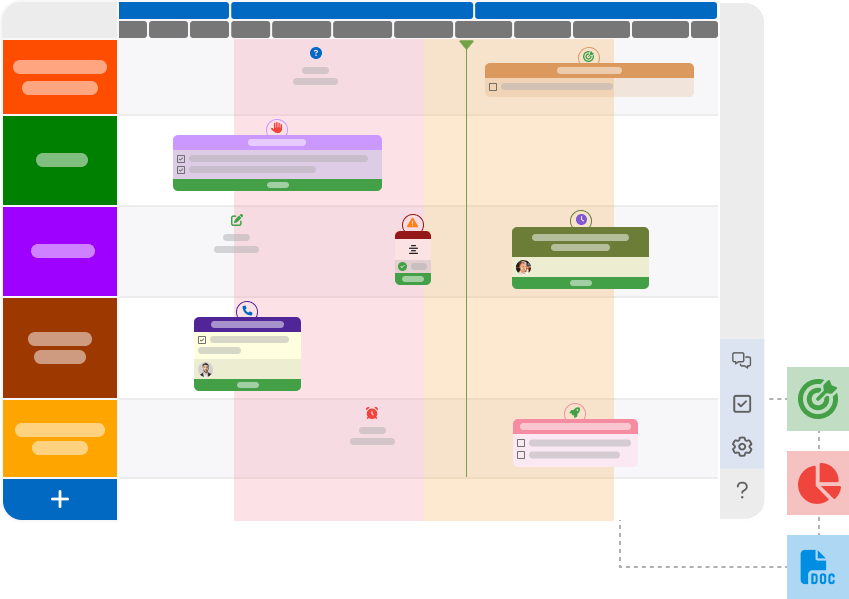
- select by line: use filters to display or hide entire lines of your planning, providing a clear perspective tailored to each project stakeholder and allowing continuous improvement.
Manage access and confidentiality level for each of your projects. With this view, you can decide whether or not to grant access to certain lines of your project planning, as well as to visual management elements such as certain bubbles or icons
Start your FREE trial now!
Enjoy all Premium features for 14 days
Start your FREE trial now!
Enjoy all Premium features for 14 days
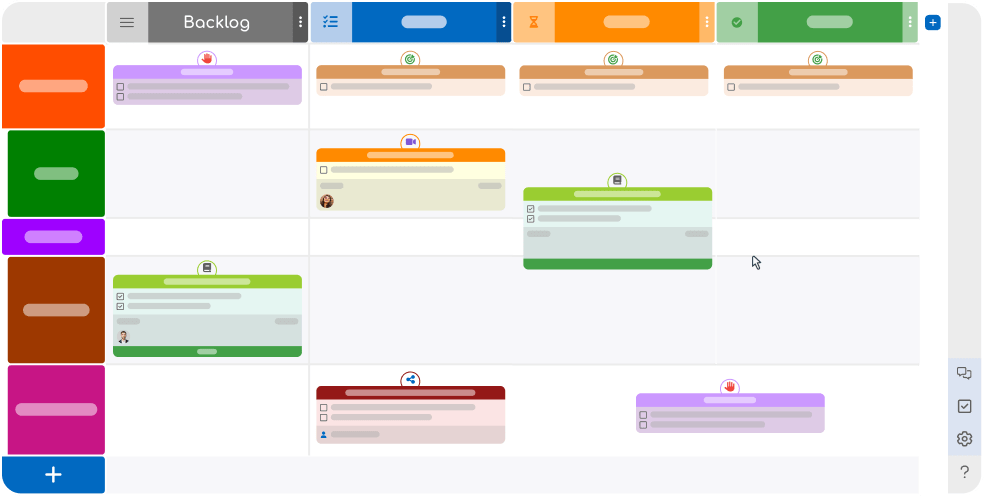
The contribution of Kanban in visual management
Integrate the Kanban status directly into each bubble of your planning for a quality, clear and dynamic overview. This feature allows you to display Kanban indicators representing different stages of the work process. This display mode enriches your planning by offering a powerful visual impact, facilitating quick progress assessment and segmentation of essential information for your project management.
These process steps are not only visible on the bubbles of your planning, but also synchronized and updated in real time in your Kanban board. This interaction between the bubbles of the planning and the Kanban board ensures smooth management and immediate visualization of project progress, facilitating decision-making and communication within your teams.